Electricity traded by fuel
Electricity traded in the power market by fuel — the latest month’s shares and the trend since 2002.
Share of traded volume by fuel (latest month, ≥0.1%)
| Period | % |
|---|---|
| Waste | 0.2 |
| Wind | 0.3 |
| Pumped storage | 0.4 |
| Anthracite | 0.4 |
| Hydro | 0.5 |
| Fuel cell | 1.6 |
| bio | 1.8 |
| Solar | 2.4 |
| LNG | 23.5 |
| Nuclear | 28.9 |
| Bituminous coal | 39.8 |
Of 11 items, the highest is Bituminous coal (39.8 %) and the lowest is Waste (0.2 %).
Source: KPX EPSIS, market trading volume · Chart: Renuary · retrieved 2026-10-22
- Unit
- %
- Period
- 2002-01–2026-08
- Updates
- Monthly, about 2 months behind (EPSIS) · retrieved 2026-10-22
- Source
- KPX EPSIS, market trading volume
- Processing
- Market trading volume, not generation.
- Download
- Raw data cannot be redistributed. Get it from the source above.
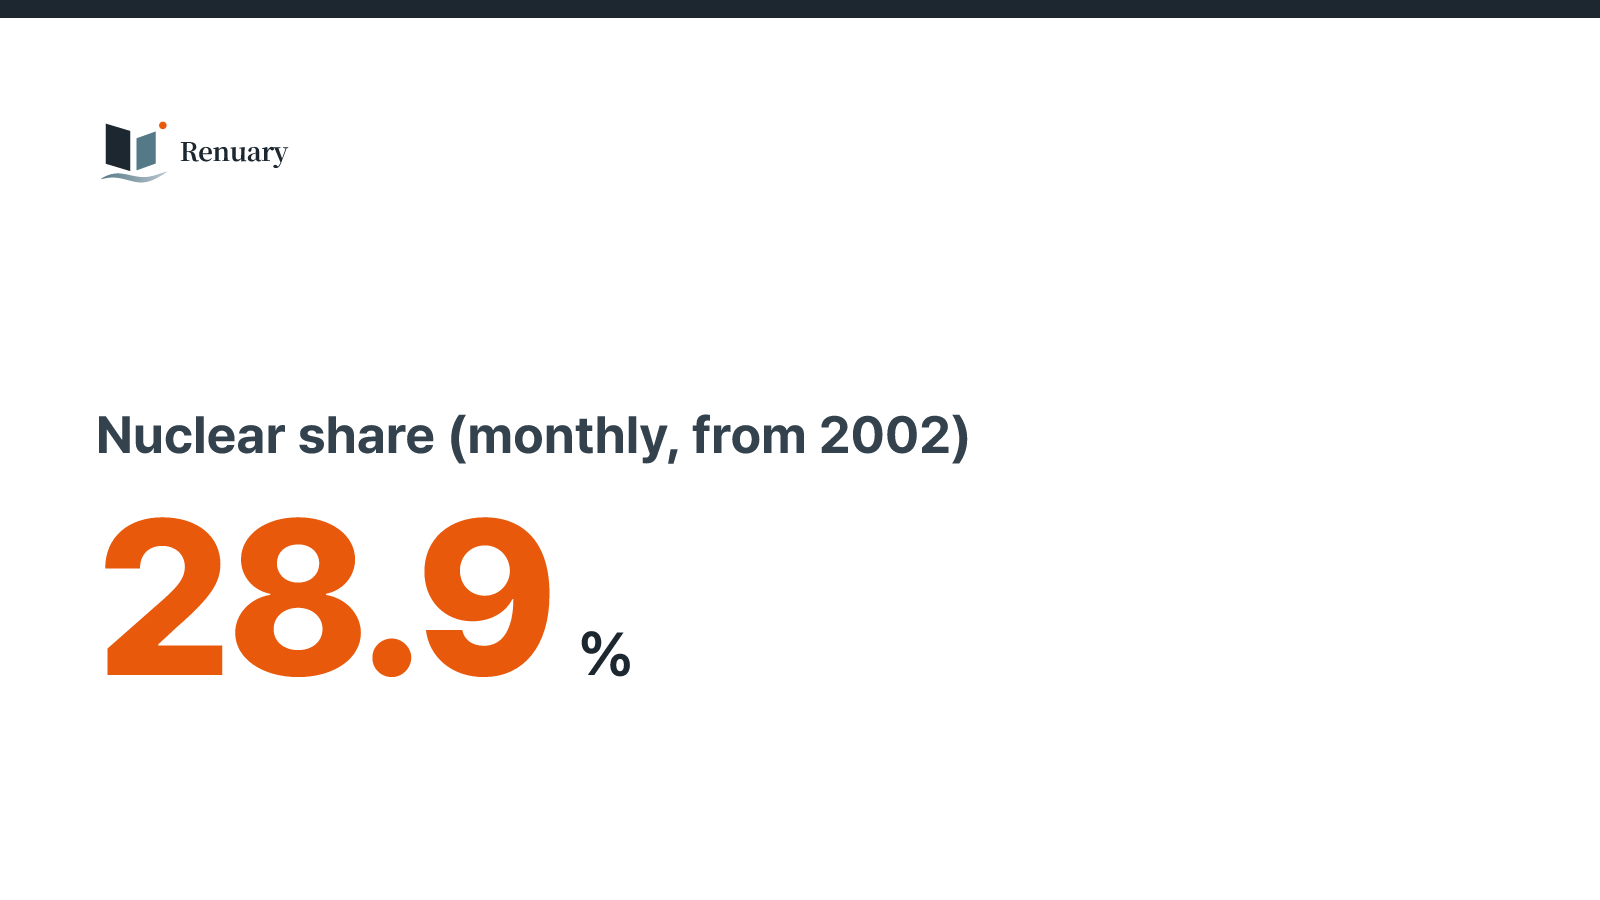
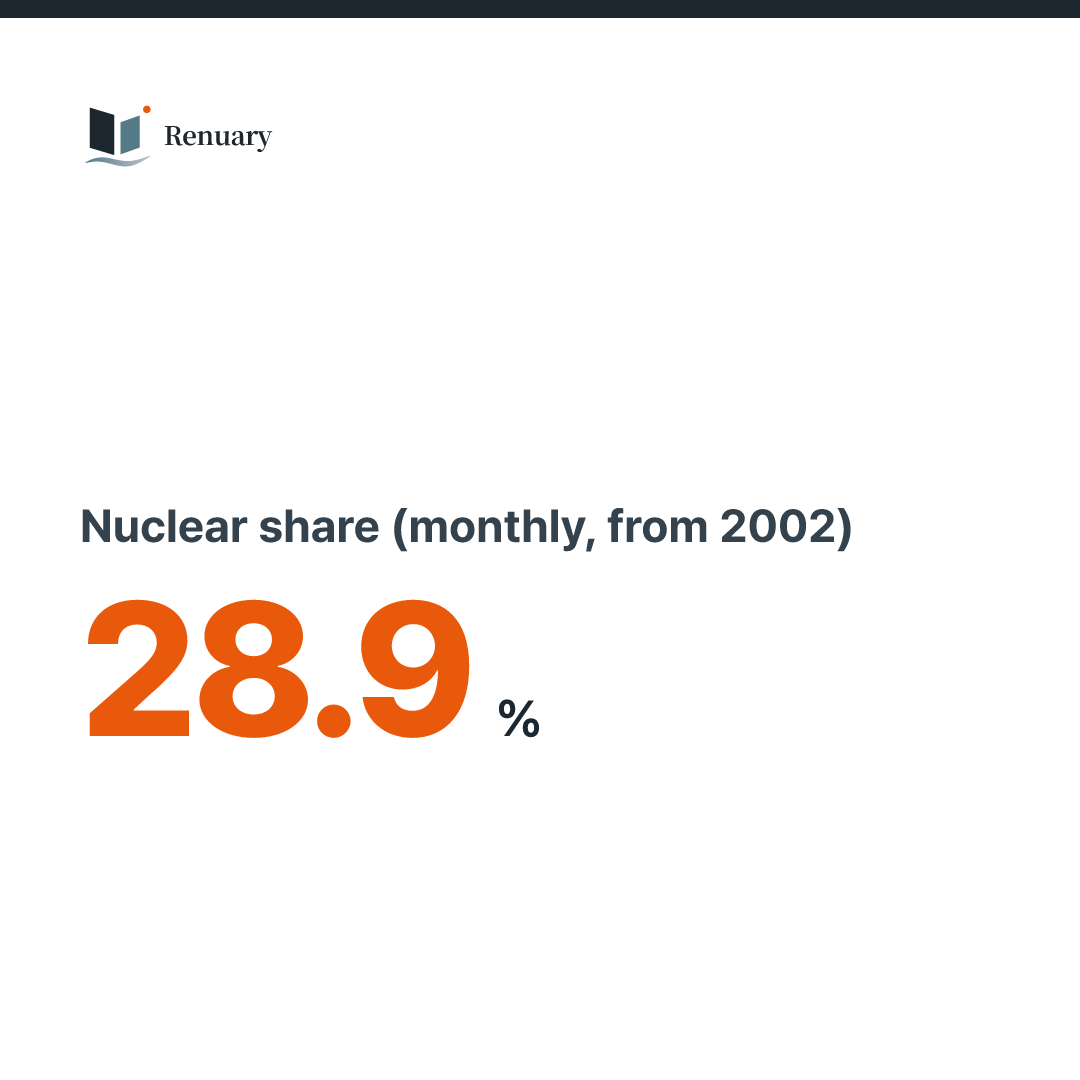
Nuclear share (monthly, from 2002)
28.9 % · 2026-08
| Period | % |
|---|---|
| 2026-08 | 28.9 |
| 2026-07 | 28.4 |
| 2026-06 | 31.6 |
| 2026-05 | 33.1 |
| 2026-04 | 32.4 |
| 2026-03 | 28.9 |
| 2026-02 | 27.2 |
| 2026-01 | 27.2 |
| 2025-12 | 30.3 |
| 2025-11 | 29.5 |
| 2025-10 | 31.3 |
| 2025-09 | 29 |
| 2025-08 | 25.5 |
| 2025-07 | 27.8 |
| 2025-06 | 33.1 |
| 2025-05 | 36.6 |
| 2025-04 | 37.5 |
| 2025-03 | 38 |
| 2025-02 | 34.1 |
| 2025-01 | 34.8 |
| 2024-12 | 32.6 |
| 2024-11 | 36 |
| 2024-10 | 38 |
| 2024-09 | 32.3 |
| Min of all 296 | 18.6 |
| Max of all 296 | 47.1 |
| Mean of all 296 | 32.8 |
296 values from 2002-01 to 2026-08. First 38.2, last 28.9 %: down -24%. Highest in 2005-05 (47.1), lowest in 2018-01 (18.6).
Source: KPX EPSIS, market trading volume · Chart: Renuary · retrieved 2026-10-22
- Unit
- %
- Period
- 2002-01–2026-08
- Updates
- Monthly, about 2 months behind (EPSIS) · retrieved 2026-10-22
- Source
- KPX EPSIS, market trading volume
- Processing
- Market trading volume, not generation.
- Download
- Raw data cannot be redistributed. Get it from the source above.
Coal share (monthly, from 2002)
40.1 % · 2026-08
| Period | % |
|---|---|
| 2026-08 | 40.1 |
| 2026-07 | 39.2 |
| 2026-06 | 34.3 |
| 2026-05 | 28.3 |
| 2026-04 | 27 |
| 2026-03 | 27.8 |
| 2026-02 | 31.4 |
| 2026-01 | 31.8 |
| 2025-12 | 34.4 |
| 2025-11 | 30.7 |
| 2025-10 | 30.9 |
| 2025-09 | 39 |
| 2025-08 | 38.6 |
| 2025-07 | 37.6 |
| 2025-06 | 30.9 |
| 2025-05 | 24.7 |
| 2025-04 | 19.6 |
| 2025-03 | 20.5 |
| 2025-02 | 24.2 |
| 2025-01 | 26 |
| 2024-12 | 29.2 |
| 2024-11 | 26.1 |
| 2024-10 | 26 |
| 2024-09 | 31 |
| Min of all 296 | 19.6 |
| Max of all 296 | 49.2 |
| Mean of all 296 | 38.79 |
296 values from 2002-01 to 2026-08. First 40.7, last 40.1 %: about level. Highest in 2009-09 (49.2), lowest in 2025-04 (19.6).
Source: KPX EPSIS, market trading volume · Chart: Renuary · retrieved 2026-10-22
- Unit
- %
- Period
- 2002-01–2026-08
- Updates
- Monthly, about 2 months behind (EPSIS) · retrieved 2026-10-22
- Source
- KPX EPSIS, market trading volume
- Processing
- Market trading volume, not generation.
- Download
- Raw data cannot be redistributed. Get it from the source above.
LNG share (monthly, from 2002)
23.5 % · 2026-08
| Period | % |
|---|---|
| 2026-08 | 23.5 |
| 2026-07 | 24.7 |
| 2026-06 | 25.2 |
| 2026-05 | 28.3 |
| 2026-04 | 31 |
| 2026-03 | 34.5 |
| 2026-02 | 32.9 |
| 2026-01 | 33.1 |
| 2025-12 | 27.3 |
| 2025-11 | 30.5 |
| 2025-10 | 28.4 |
| 2025-09 | 24.4 |
| 2025-08 | 28.3 |
| 2025-07 | 26.3 |
| 2025-06 | 26.4 |
| 2025-05 | 28.5 |
| 2025-04 | 32.7 |
| 2025-03 | 32.7 |
| 2025-02 | 33.1 |
| 2025-01 | 31.4 |
| 2024-12 | 30.3 |
| 2024-11 | 30 |
| 2024-10 | 27.8 |
| 2024-09 | 29 |
| Min of all 296 | 7.7 |
| Max of all 296 | 35.3 |
| Mean of all 296 | 21.8 |
296 values from 2002-01 to 2026-08. First 11.5, last 23.5 %: up +104%. Highest in 2022-03 (35.3), lowest in 2003-10 (7.7).
Source: KPX EPSIS, market trading volume · Chart: Renuary · retrieved 2026-10-22
- Unit
- %
- Period
- 2002-01–2026-08
- Updates
- Monthly, about 2 months behind (EPSIS) · retrieved 2026-10-22
- Source
- KPX EPSIS, market trading volume
- Processing
- Market trading volume, not generation.
- Download
- Raw data cannot be redistributed. Get it from the source above.
Renewables share (monthly, from 2002)
6.9 % · 2026-08
| Period | % |
|---|---|
| 2026-08 | 6.9 |
| 2026-07 | 7.1 |
| 2026-06 | 8.2 |
| 2026-05 | 9.3 |
| 2026-04 | 8.7 |
| 2026-03 | 7.9 |
| 2026-02 | 7.6 |
| 2026-01 | 6.9 |
| 2025-12 | 6.9 |
| 2025-11 | 7.8 |
| 2025-10 | 8.2 |
| 2025-09 | 6.7 |
| 2025-08 | 6.9 |
| 2025-07 | 7 |
| 2025-06 | 8.2 |
| 2025-05 | 8.9 |
| 2025-04 | 8.6 |
| 2025-03 | 7.5 |
| 2025-02 | 7.4 |
| 2025-01 | 6.6 |
| 2024-12 | 6.4 |
| 2024-11 | 6.3 |
| 2024-10 | 6.6 |
| 2024-09 | 6.4 |
| Min of all 296 | 0.1 |
| Max of all 296 | 9.3 |
| Mean of all 296 | 3.39 |
296 values from 2002-01 to 2026-08. First 0.4, last 6.9 %: up. Highest in 2026-05 (9.3), lowest in 2002-03 (0.1).
Source: KPX EPSIS, market trading volume · Chart: Renuary · retrieved 2026-10-22
- Unit
- %
- Period
- 2002-01–2026-08
- Updates
- Monthly, about 2 months behind (EPSIS) · retrieved 2026-10-22
- Source
- KPX EPSIS, market trading volume
- Processing
- Market trading volume, not generation.
- Download
- Raw data cannot be redistributed. Get it from the source above.
Stat cardWide PNGSquare PNG