Renewables share of traded power
Renewables’ share of electricity traded in the power market — monthly, from 2002.
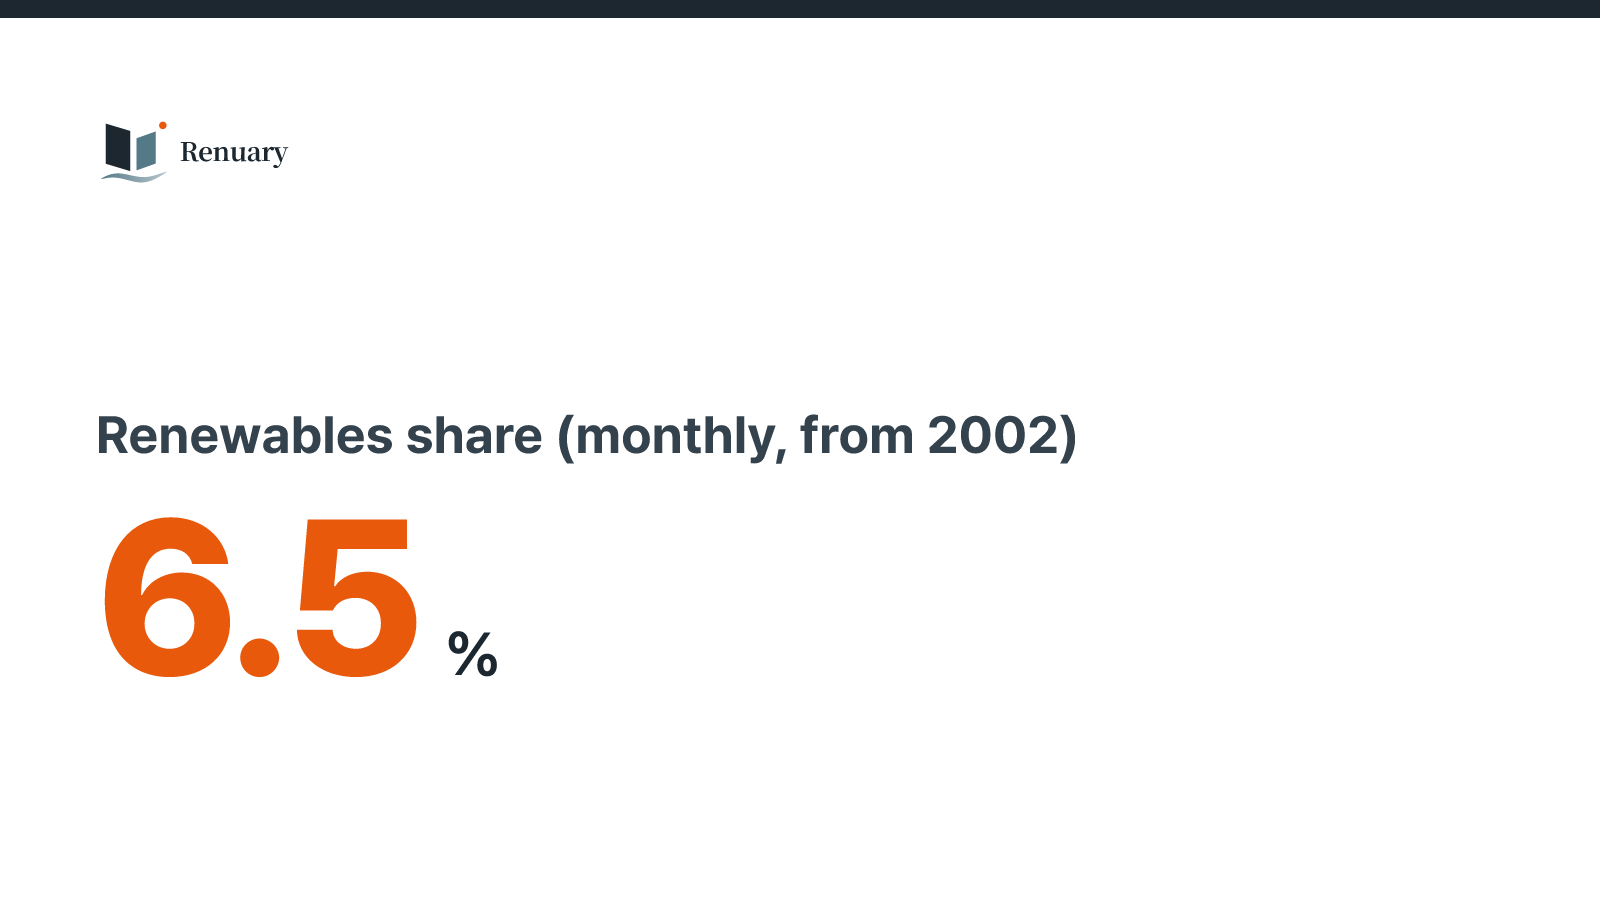
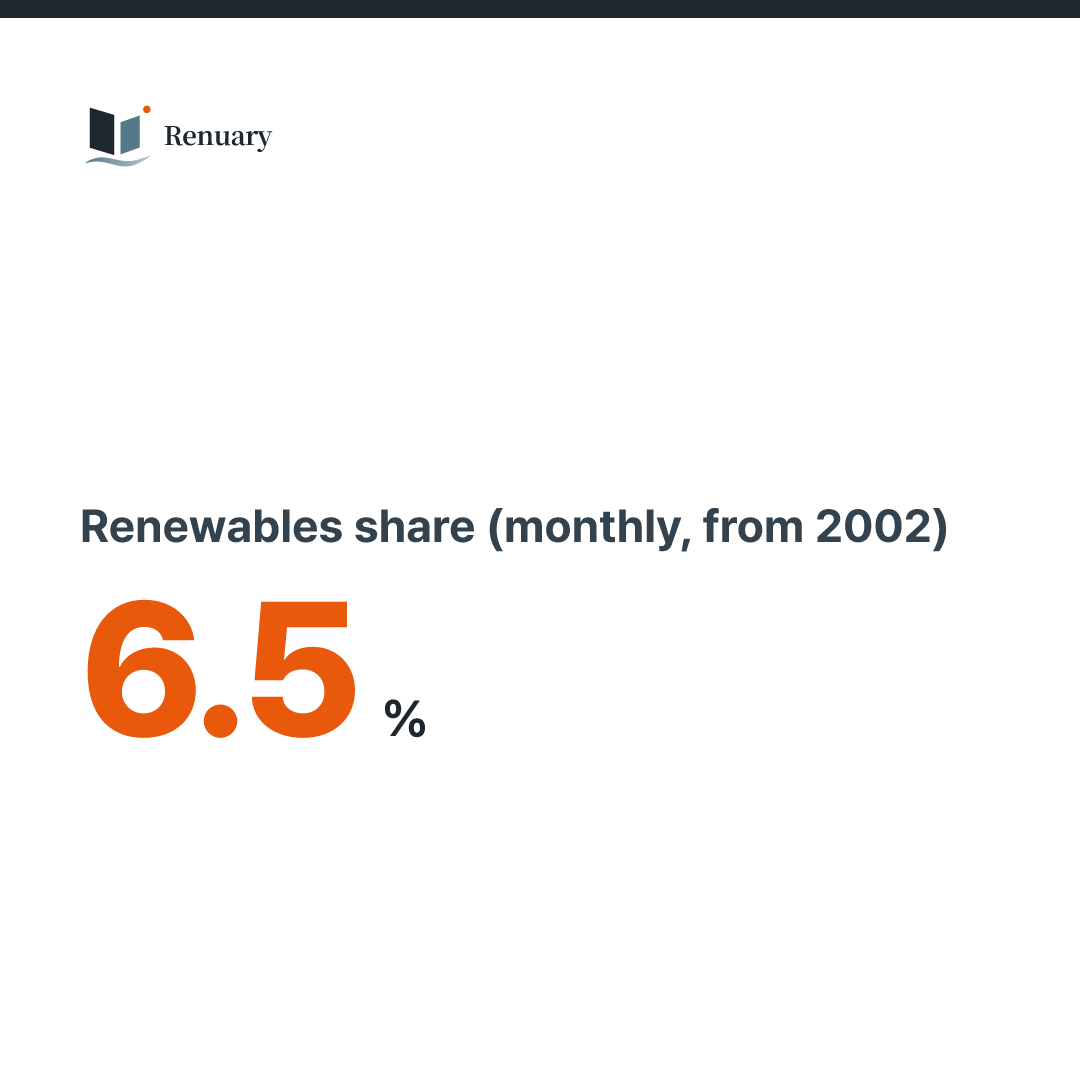
Renewables share (monthly, from 2002)
6.54 % · 2026-08
| Period | % |
|---|---|
| 2026-08 | 6.54 |
| 2026-07 | 6.75 |
| 2026-06 | 7.63 |
| 2026-05 | 8.6 |
| 2026-04 | 8.16 |
| 2026-03 | 7.41 |
| 2026-02 | 7.24 |
| 2026-01 | 6.68 |
| 2025-12 | 6.73 |
| 2025-11 | 7.47 |
| 2025-10 | 7.86 |
| 2025-09 | 6.49 |
| 2025-08 | 6.6 |
| 2025-07 | 6.61 |
| 2025-06 | 7.73 |
| 2025-05 | 8.43 |
| 2025-04 | 8.04 |
| 2025-03 | 7.11 |
| 2025-02 | 7.13 |
| 2025-01 | 6.44 |
| 2024-12 | 6.21 |
| 2024-11 | 6.13 |
| 2024-10 | 6.41 |
| 2024-09 | 6.19 |
| Min of all 296 | 0.14 |
| Max of all 296 | 8.6 |
| Mean of all 296 | 3.33 |
296 values from 2002-01 to 2026-08. First 0.39, last 6.54 %: up. Highest in 2026-05 (8.6), lowest in 2002-03 (0.14).
Source: KPX EPSIS, market trading volume · Chart: Renuary · retrieved 2026-10-22
- Unit
- %
- Period
- 2002-01–2026-08
- Updates
- Monthly, about 2 months behind (EPSIS) · retrieved 2026-10-22
- Source
- KPX EPSIS, market trading volume
- Processing
- Renewables subtotal ÷ total traded (incl. PPA; market total where missing). Excludes self-consumption.
- Download
- Raw data cannot be redistributed. Get it from the source above.
Renewables traded (5 years)
3,592.07 GWh · 2026-08
| Period | GWh |
|---|---|
| 2026-08 | 3,592.07 |
| 2026-07 | 3,659.34 |
| 2026-06 | 3,506.67 |
| 2026-05 | 3,785.4 |
| 2026-04 | 3,488.17 |
| 2026-03 | 3,426.96 |
| 2026-02 | 3,200.95 |
| 2026-01 | 3,537.74 |
| 2025-12 | 3,369.29 |
| 2025-11 | 3,286.49 |
| 2025-10 | 3,407.23 |
| 2025-09 | 3,146.38 |
| 2025-08 | 3,622.41 |
| 2025-07 | 3,624.38 |
| 2025-06 | 3,539.39 |
| 2025-05 | 3,687.41 |
| 2025-04 | 3,466.46 |
| 2025-03 | 3,339.14 |
| 2025-02 | 3,357.7 |
| 2025-01 | 3,235.27 |
| 2024-12 | 3,115.6 |
| 2024-11 | 2,701.67 |
| 2024-10 | 2,830.47 |
| 2024-09 | 3,006.31 |
| Min of all 60 | 2,051.23 |
| Max of all 60 | 3,785.4 |
| Mean of all 60 | 3,014.64 |
60 values from 2021-09 to 2026-08. First 2,159.71, last 3,592.07 GWh: up +66%. Highest in 2026-05 (3,785.4), lowest in 2021-11 (2,051.23).
Source: KPX EPSIS, market trading volume · Chart: Renuary · retrieved 2026-10-22
- Unit
- GWh
- Period
- 2002-01–2026-08
- Updates
- Monthly, about 2 months behind (EPSIS) · retrieved 2026-10-22
- Source
- KPX EPSIS, market trading volume
- Processing
- Renewables subtotal ÷ total traded (incl. PPA; market total where missing). Excludes self-consumption.
- Download
- Raw data cannot be redistributed. Get it from the source above.
Stat cardWide PNGSquare PNG