Solar and wind capacity
How much solar and wind capacity has built up in the power market — cumulative.
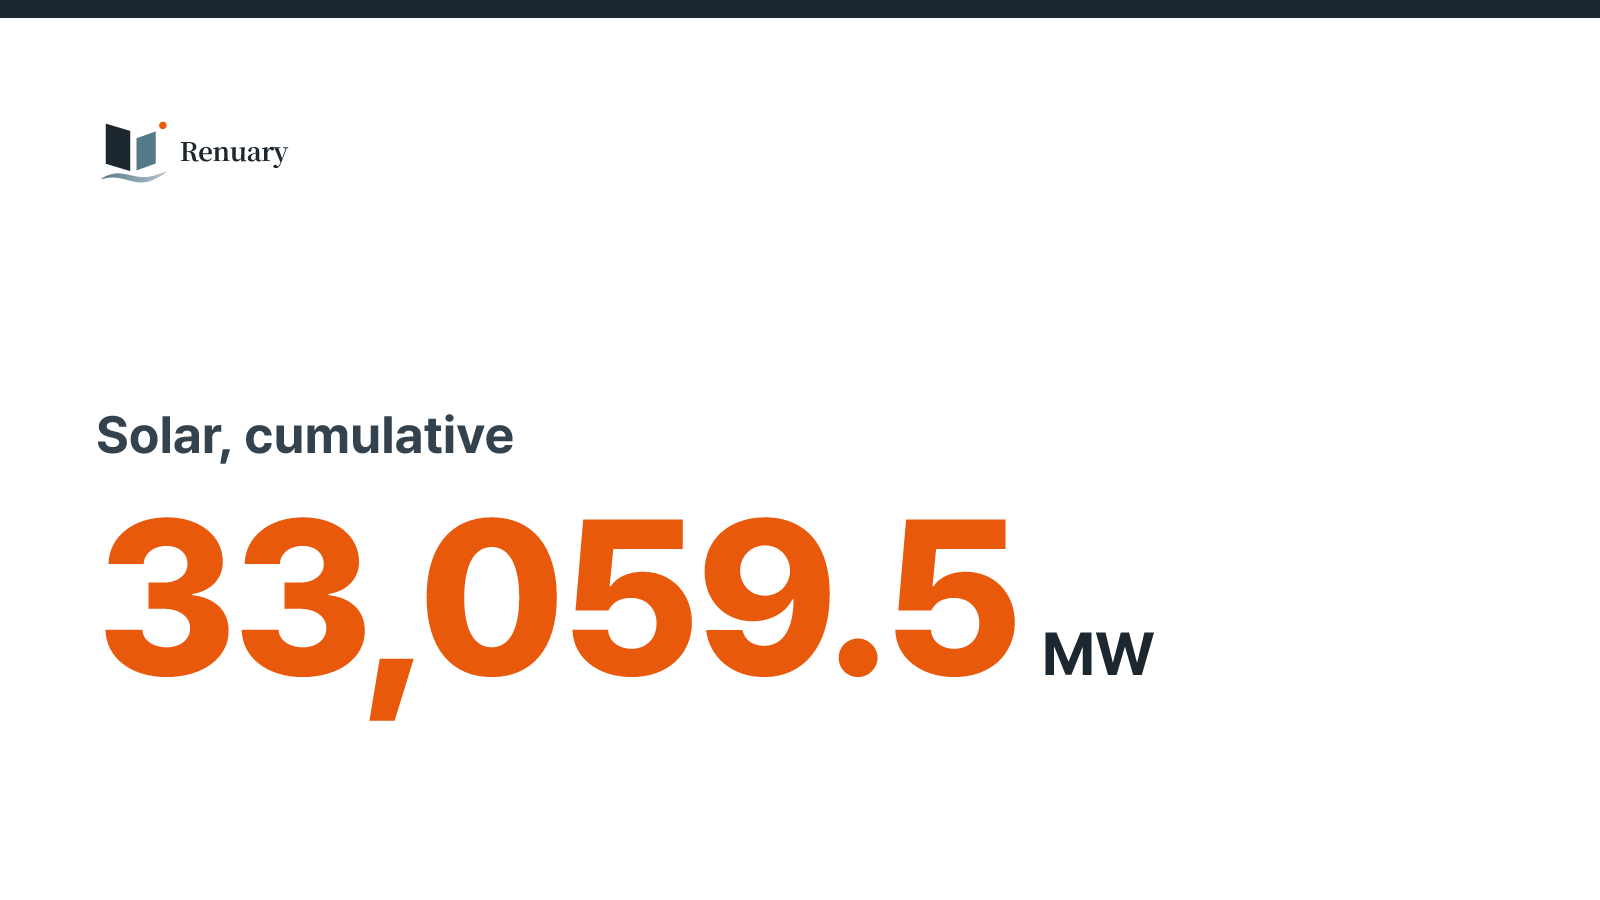
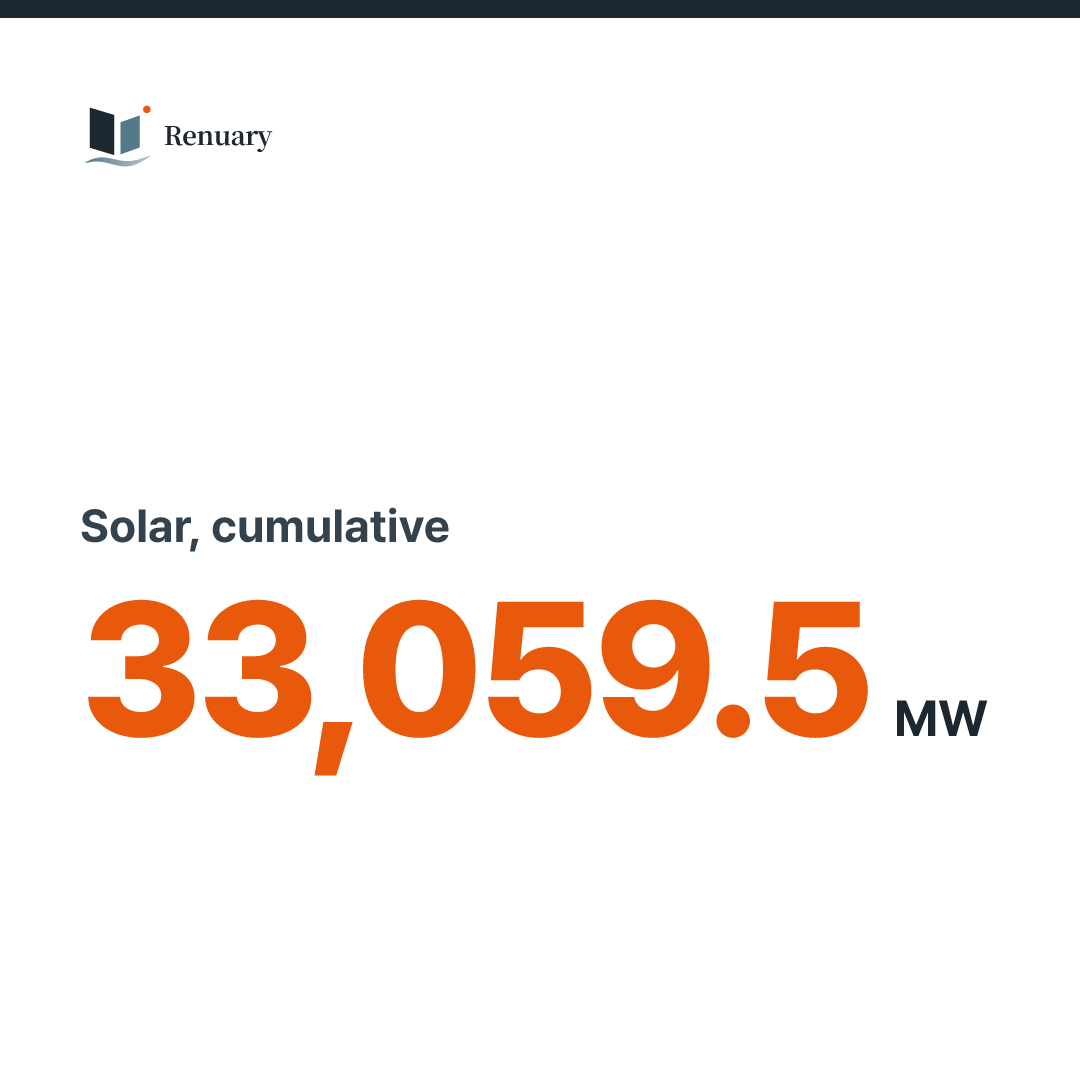
Solar, cumulative
33,059.5 MW · 2026-10
| Period | MW |
|---|---|
| 2026-10 | 33,059.5 |
| 2026-09 | 33,059.5 |
| 2026-08 | 33,059.5 |
| 2026-07 | 33,053.5 |
| 2026-06 | 32,702.1 |
| 2026-05 | 32,414.8 |
| 2026-04 | 32,131.5 |
| 2026-03 | 31,839.1 |
| 2026-02 | 31,431 |
| 2026-01 | 31,283.7 |
| 2025-12 | 30,761 |
| 2025-11 | 30,321.9 |
| 2025-10 | 30,056.8 |
| 2025-09 | 29,716.4 |
| 2025-08 | 29,568.3 |
| 2025-07 | 29,222.9 |
| 2025-06 | 28,874.7 |
| 2025-05 | 28,654.4 |
| 2025-04 | 28,285.4 |
| 2025-03 | 27,901.1 |
| 2025-02 | 27,489.4 |
| 2025-01 | 27,452.9 |
| 2024-12 | 27,094.8 |
| 2024-11 | 26,834.7 |
| Min of all 112 | 690.3 |
| Max of all 112 | 33,059.5 |
| Mean of all 112 | 18,076.52 |
112 values from 2012-12 to 2026-10. First 690.3, last 33,059.5 MW: up. Highest in 2026-08 (33,059.5), lowest in 2012-12 (690.3).
Source: KPX EPSIS, installed capacity · Chart: Renuary · retrieved 2026-11-01
- Unit
- MW
- Period
- 2012-12–2026-10
- Updates
- Monthly (EPSIS) · retrieved 2026-11-01
- Source
- KPX EPSIS, installed capacity
- Processing
- As published (market-registered capacity).
- Download
- Raw data cannot be redistributed. Get it from the source above.
Wind, cumulative
2,569.5 MW · 2026-10
| Period | MW |
|---|---|
| 2026-10 | 2,569.5 |
| 2026-09 | 2,569.5 |
| 2026-08 | 2,569.5 |
| 2026-07 | 2,470.5 |
| 2026-06 | 2,470.5 |
| 2026-05 | 2,470.5 |
| 2026-04 | 2,470.5 |
| 2026-03 | 2,470.5 |
| 2026-02 | 2,454.9 |
| 2026-01 | 2,437.3 |
| 2025-12 | 2,437.3 |
| 2025-11 | 2,351.9 |
| 2025-10 | 2,385.9 |
| 2025-09 | 2,385.9 |
| 2025-08 | 2,289.9 |
| 2025-07 | 2,289.9 |
| 2025-06 | 2,266.4 |
| 2025-05 | 2,263.4 |
| 2025-04 | 2,263.4 |
| 2025-03 | 2,263.4 |
| 2025-02 | 2,263.4 |
| 2025-01 | 2,263.4 |
| 2024-12 | 2,247.8 |
| 2024-11 | 2,247.8 |
| Min of all 112 | 476.7 |
| Max of all 112 | 2,569.5 |
| Mean of all 112 | 1,791.53 |
112 values from 2012-12 to 2026-10. First 476.7, last 2,569.5 MW: up. Highest in 2026-08 (2,569.5), lowest in 2012-12 (476.7).
Source: KPX EPSIS, installed capacity · Chart: Renuary · retrieved 2026-11-01
- Unit
- MW
- Period
- 2012-12–2026-10
- Updates
- Monthly (EPSIS) · retrieved 2026-11-01
- Source
- KPX EPSIS, installed capacity
- Processing
- As published (market-registered capacity).
- Download
- Raw data cannot be redistributed. Get it from the source above.
Stat cardWide PNGSquare PNG