Natural gas tariff for power generation
What KOGAS charges power plants for natural gas — feedstock and supply cost, per GJ.
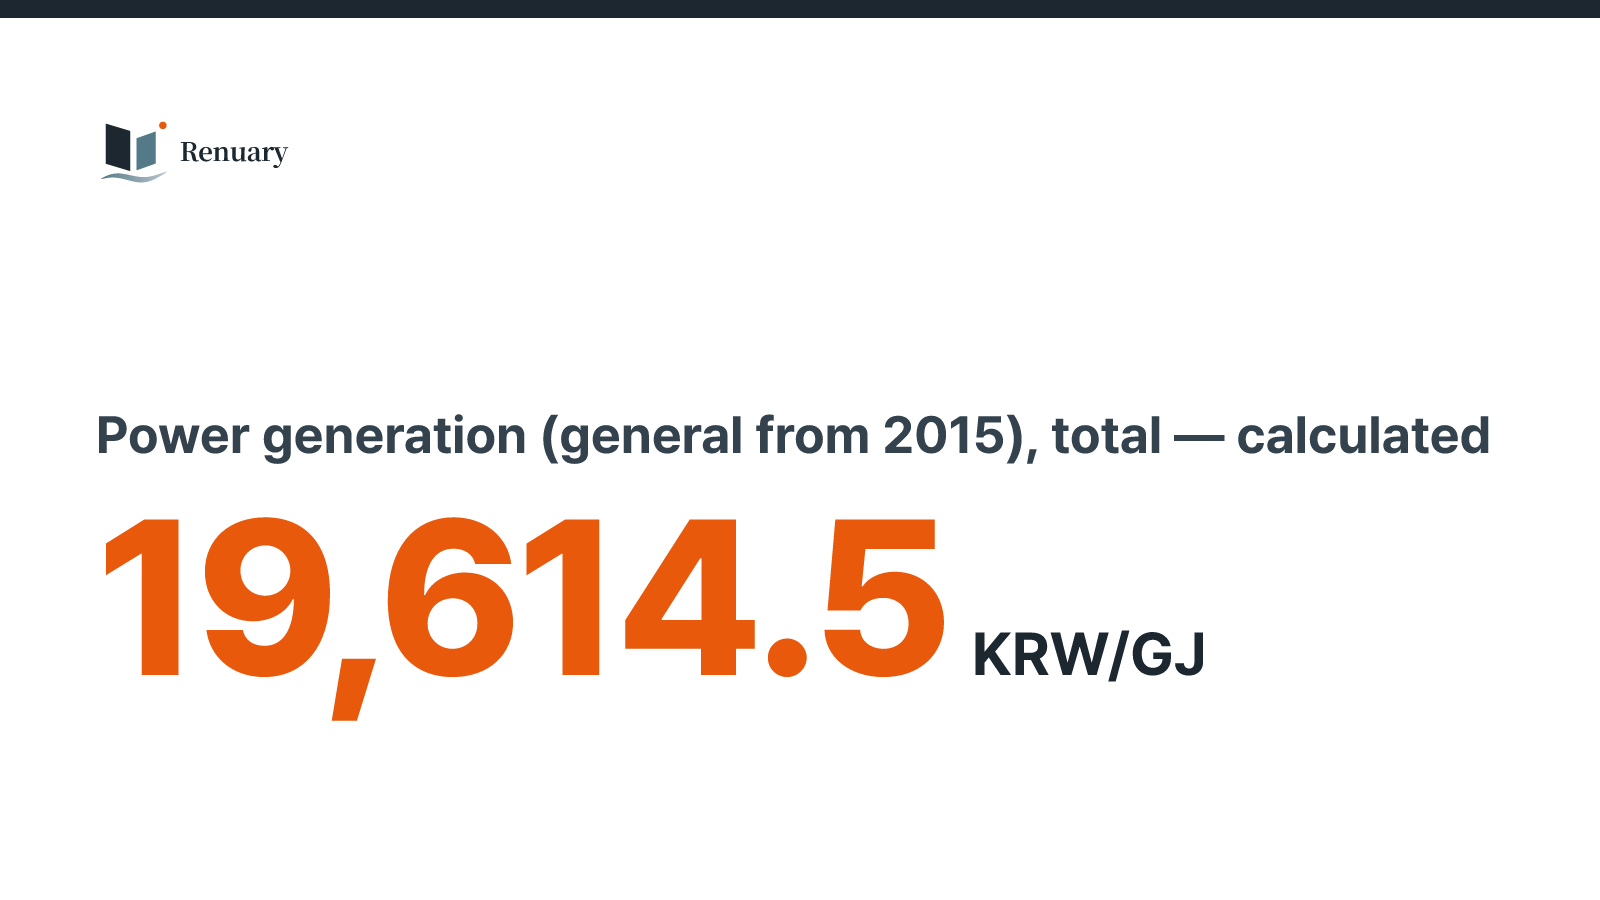
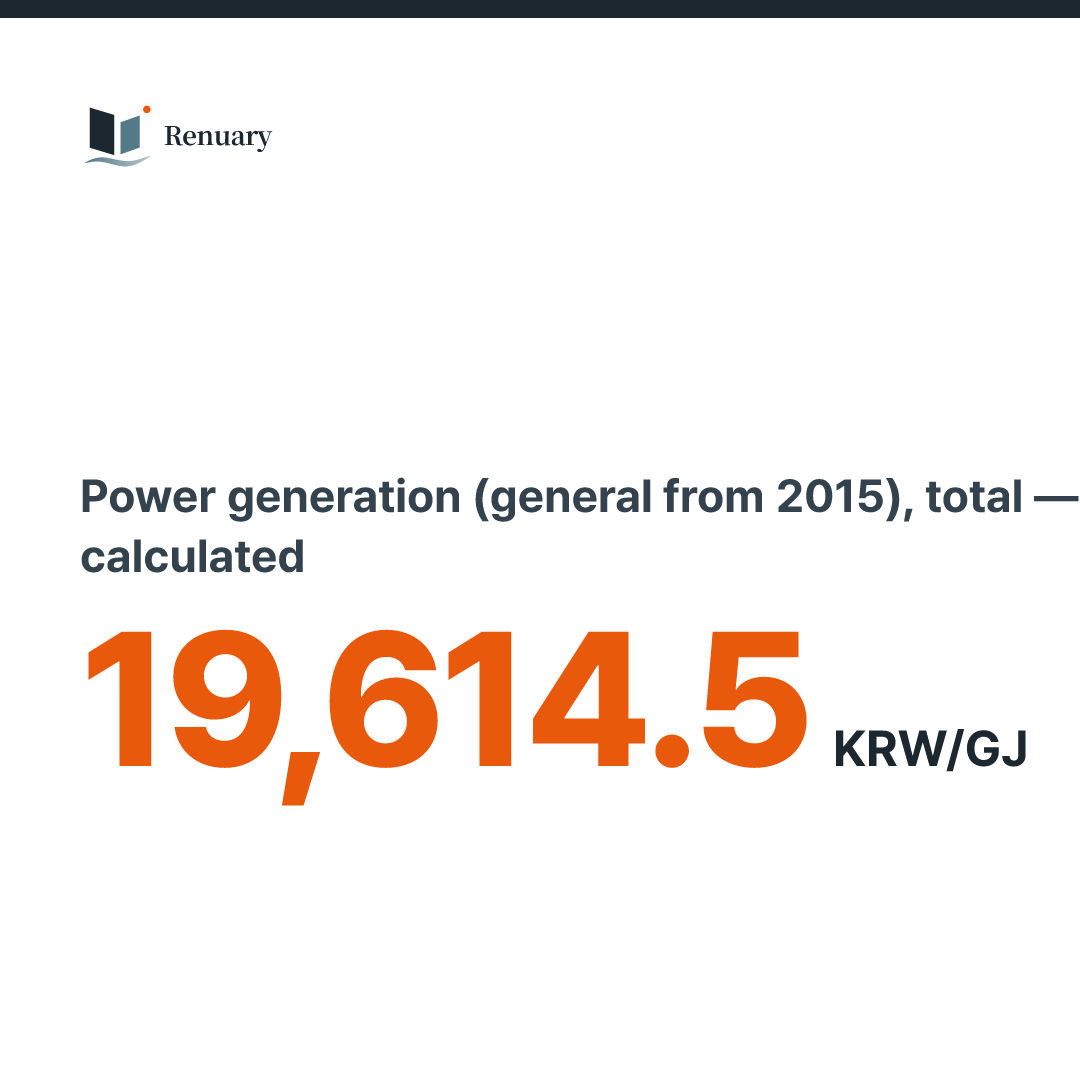
Power generation (general from 2015), total — calculated
19,614.52 KRW/GJ · 2024-07
| Period | KRW/GJ |
|---|---|
| 2024-07 | 19,614.52 |
| 2024-06 | 19,202.45 |
| 2024-05 | 19,769.4 |
| 2024-04 | 20,356.97 |
| 2024-03 | 22,019.28 |
| 2024-02 | 21,702.07 |
| 2024-01 | 23,996.67 |
| 2023-12 | 21,633.42 |
| 2023-11 | 20,293.36 |
| 2023-10 | 22,592.36 |
| 2023-09 | 21,340.58 |
| 2023-08 | 21,616.06 |
| 2023-07 | 22,867.94 |
| 2023-06 | 22,087.5 |
| 2023-05 | 22,891.73 |
| 2023-04 | 24,654.06 |
| 2023-03 | 33,645.82 |
| 2023-02 | 35,676.91 |
| 2023-01 | 36,104.76 |
| 2022-12 | 37,895.76 |
| 2022-11 | 35,871.82 |
| 2022-10 | 36,743.25 |
| 2022-09 | 34,545.16 |
| 2022-08 | 30,356.41 |
| Min of all 199 | 7,114.85 |
| Max of all 199 | 37,895.76 |
| Mean of all 199 | 16,410.02 |
199 values from 2008-01 to 2024-07. First 13,143.34, last 19,614.52 KRW/GJ: up +49%. Highest in 2022-12 (37,895.76), lowest in 2020-11 (7,114.85).
Source: KOGAS, data.go.kr 15129722 (FILE_000000002943673) · Chart: Renuary · retrieved 2026-09-28
- Unit
- KRW/GJ
- Period
- 2008-01~2024-07
- Updates
- One-off release — no longer updated · retrieved 2026-09-28
- Source
- KOGAS, data.go.kr 15129722 (FILE_000000002943673)
- Processing
- segment: all (2008–2014) · general (general power) · district_energy (district energy, from 2015). A one-off release, so nothing after 2024-08.
- Download
- CSV
Feedstock cost
17,652.13 KRW/GJ · 2024-07
| Period | KRW/GJ |
|---|---|
| 2024-07 | 17,652.13 |
| 2024-06 | 17,240.06 |
| 2024-05 | 17,807.01 |
| 2024-04 | 18,922.04 |
| 2024-03 | 20,584.35 |
| 2024-02 | 20,267.14 |
| 2024-01 | 22,561.74 |
| 2023-12 | 20,198.49 |
| 2023-11 | 18,858.43 |
| 2023-10 | 21,157.43 |
| 2023-09 | 19,905.65 |
| 2023-08 | 20,181.13 |
| 2023-07 | 21,433.01 |
| 2023-06 | 20,652.57 |
| 2023-05 | 21,456.8 |
| 2023-04 | 23,610.37 |
| 2023-03 | 32,602.13 |
| 2023-02 | 34,633.22 |
| 2023-01 | 35,061.07 |
| 2022-12 | 36,852.07 |
| 2022-11 | 34,828.13 |
| 2022-10 | 35,699.56 |
| 2022-09 | 33,501.47 |
| 2022-08 | 29,312.72 |
| Min of all 199 | 6,385.44 |
| Max of all 199 | 36,852.07 |
| Mean of all 199 | 15,303.61 |
199 values from 2008-01 to 2024-07. First 12,014.39, last 17,652.13 KRW/GJ: up +47%. Highest in 2022-12 (36,852.07), lowest in 2020-11 (6,385.44).
Source: KOGAS, data.go.kr 15129722 (FILE_000000002943673) · Chart: Renuary · retrieved 2026-09-28
- Unit
- KRW/GJ
- Period
- 2008-01~2024-07
- Updates
- One-off release — no longer updated · retrieved 2026-09-28
- Source
- KOGAS, data.go.kr 15129722 (FILE_000000002943673)
- Processing
- segment: all (2008–2014) · general (general power) · district_energy (district energy, from 2015). A one-off release, so nothing after 2024-08.
- Download
- CSV
Supply cost
1,962.39 KRW/GJ · 2024-07
| Period | KRW/GJ |
|---|---|
| 2024-07 | 1,962.39 |
| 2024-06 | 1,962.39 |
| 2024-05 | 1,962.39 |
| 2024-04 | 1,434.93 |
| 2024-03 | 1,434.93 |
| 2024-02 | 1,434.93 |
| 2024-01 | 1,434.93 |
| 2023-12 | 1,434.93 |
| 2023-11 | 1,434.93 |
| 2023-10 | 1,434.93 |
| 2023-09 | 1,434.93 |
| 2023-08 | 1,434.93 |
| 2023-07 | 1,434.93 |
| 2023-06 | 1,434.93 |
| 2023-05 | 1,434.93 |
| 2023-04 | 1,043.69 |
| 2023-03 | 1,043.69 |
| 2023-02 | 1,043.69 |
| 2023-01 | 1,043.69 |
| 2022-12 | 1,043.69 |
| 2022-11 | 1,043.69 |
| 2022-10 | 1,043.69 |
| 2022-09 | 1,043.69 |
| 2022-08 | 1,043.69 |
| Min of all 199 | 491.09 |
| Max of all 199 | 2,536.38 |
| Mean of all 199 | 1,106.41 |
199 values from 2008-01 to 2024-07. First 1,128.95, last 1,962.39 KRW/GJ: up +74%. Highest in 2017-12 (2,536.38), lowest in 2008-06 (491.09).
Source: KOGAS, data.go.kr 15129722 (FILE_000000002943673) · Chart: Renuary · retrieved 2026-09-28
- Unit
- KRW/GJ
- Period
- 2008-01~2024-07
- Updates
- One-off release — no longer updated · retrieved 2026-09-28
- Source
- KOGAS, data.go.kr 15129722 (FILE_000000002943673)
- Processing
- segment: all (2008–2014) · general (general power) · district_energy (district energy, from 2015). A one-off release, so nothing after 2024-08.
- Download
- CSV
District energy, total (from 2015) — calculated
19,581.6 KRW/GJ · 2024-07
| Period | KRW/GJ |
|---|---|
| 2024-07 | 19,581.6 |
| 2024-06 | 19,169.53 |
| 2024-05 | 19,736.67 |
| 2024-04 | 20,324.34 |
| 2024-03 | 21,986.73 |
| 2024-02 | 21,669.45 |
| 2024-01 | 23,963.84 |
| 2023-12 | 21,600.57 |
| 2023-11 | 20,260.44 |
| 2023-10 | 22,559.44 |
| 2023-09 | 21,307.66 |
| 2023-08 | 21,583.14 |
| 2023-07 | 22,835.03 |
| 2023-06 | 22,054.56 |
| 2023-05 | 22,858.95 |
| 2023-04 | 24,621.65 |
| 2023-03 | 33,613.45 |
| 2023-02 | 35,644.36 |
| 2023-01 | 36,072.68 |
| 2022-12 | 37,863 |
| 2022-11 | 35,839.02 |
| 2022-10 | 36,710.57 |
| 2022-09 | 34,512.26 |
| 2022-08 | 30,290.7 |
| Min of all 115 | 7,048.08 |
| Max of all 115 | 37,863 |
| Mean of all 115 | 15,919.22 |
115 values from 2015-01 to 2024-07. First 17,735.22, last 19,581.6 KRW/GJ: up +10%. Highest in 2022-12 (37,863), lowest in 2020-11 (7,048.08).
Source: KOGAS, data.go.kr 15129722 (FILE_000000002943673) · Chart: Renuary · retrieved 2026-09-28
- Unit
- KRW/GJ
- Period
- 2008-01~2024-07
- Updates
- One-off release — no longer updated · retrieved 2026-09-28
- Source
- KOGAS, data.go.kr 15129722 (FILE_000000002943673)
- Processing
- segment: all (2008–2014) · general (general power) · district_energy (district energy, from 2015). A one-off release, so nothing after 2024-08.
- Download
- CSV
Stat cardWide PNGSquare PNG