Published
Contents (8)
- 01What happens in the city at 4 a.m. and at 7 p.m.?
- 02Why does the price go up when demand crowds in?
- 03Why does the price dip once at midday?
- 04When is the busiest day of the year?
- 05Does my home bill get pricier in the evening too?
- 06What to watch when using these numbers
- 07So, when you read power news
- 08Words in this piece
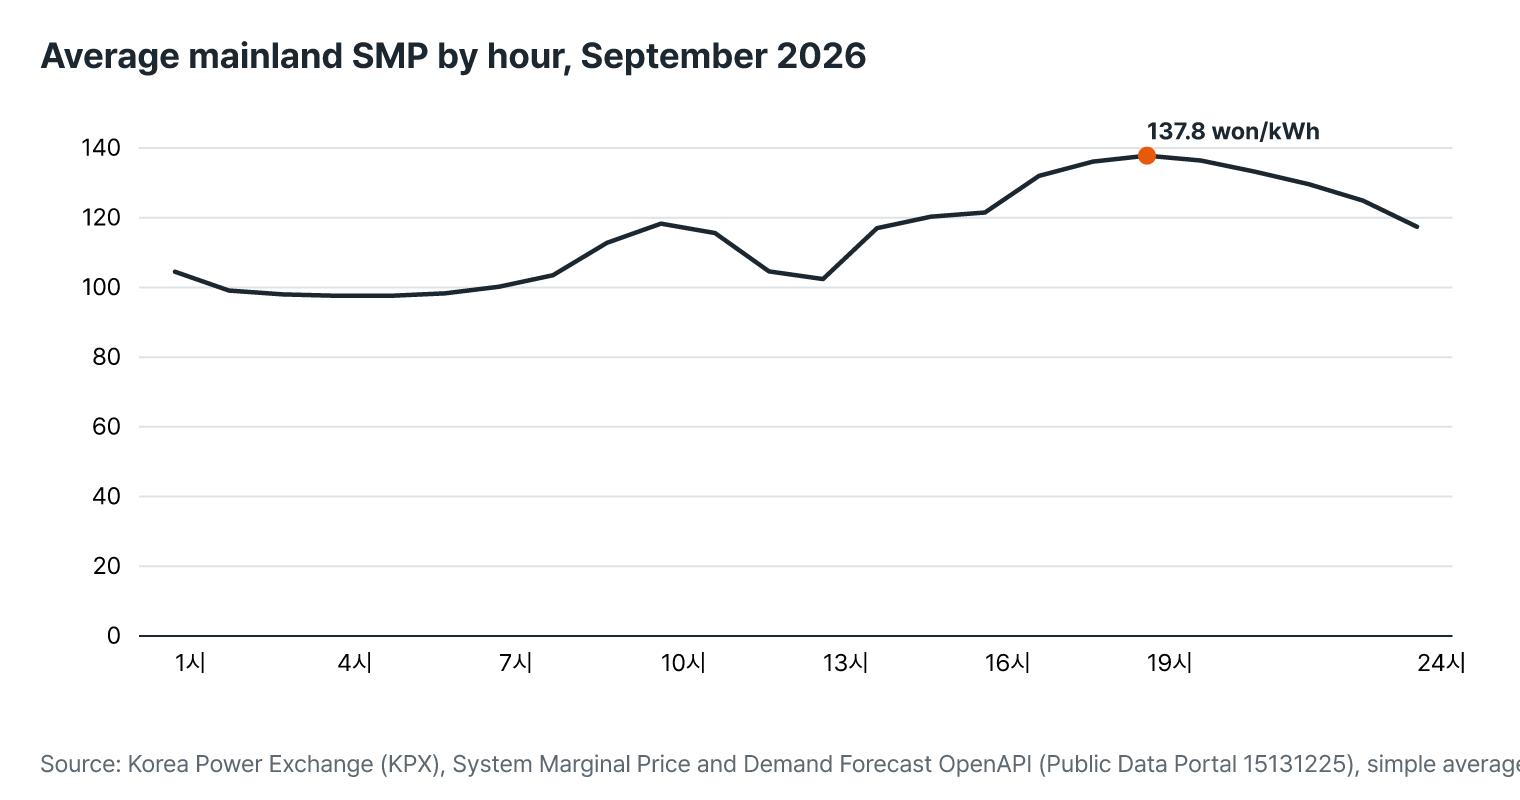
The same 1 kWh of electricity costs 97.6 won (Korean currency) at 4 a.m. and 137.8 won at 7 p.m. These are the average prices actually set in the mainland power market over the month of September 2026.
Average SMP by hour, mainland, September 2026 (same as the table in the text).
The wires are the same and so is the electricity, yet, averaged over September, the price is 40 won higher in the evening than in early morning. What changes is which generators have to be running at that hour. Follow where those 40 won come from, and you also see what the "power supply emergency" headlines worry about every summer.
What happens in the city at 4 a.m. and at 7 p.m.?
At 4 a.m. the city is quiet. Office lights are off, and many factory machines have stopped. What uses power is refrigerators, streetlights and a few factories that run all night.
When the sun comes up, commuter trains run, office computers come on and factory lines start. In the evening, lights go on in every home and rice cookers and washing machines run. Draw this day hour by hour and you get a hill: low before dawn, rising high in the evening. The grid has to follow this hill at every moment. That is because the amount used and the amount made must match at the same instant.
Lately the hill has one more feature. During the day, solar panels on roofs and in fields cover part of the demand.
So the electricity that has to be bought in the market (demand minus the share covered by solar on roofs and in fields) actually shrinks at midday. Then, when the sun sets, that share disappears all at once and the amount grows sharply in the evening. Sunset is when solar drops out just as people come home.
A shape-only sketch. At sunset the solar share disappears at once and the evening load falls to other generators.
Why does the price go up when demand crowds in?
The power market switches generators on from the cheapest up. Before dawn, when there are few customers, the cheap generators are enough. In the evening, when customers crowd in, even the expensive ones have to come on.
The wholesale price for that hour, the SMP (System Marginal Price) SMP is the energy price set for each trading hour in the power market. It is the highest generation price among the generators eligible to set the price in that hour. Glossary → (system marginal price), is set by the cost of the last generator switched on. So the more electricity that has to be bought in the market, the higher the price. In the numbers, the day's hill shows up directly in the price.
Show the numbers
| Hour | Average SMP (won/kWh) |
|---|---|
| 4 a.m. | 97.6 |
| 8 a.m. | 103.5 |
| 10 a.m. | 118.3 |
| 1 p.m. | 102.4 |
| 7 p.m. | 137.8 |
| Midnight | 117.4 |
Each hour is labeled by when it ends.
Data Korea Power Exchange (KPX), System Marginal Price OpenAPI (Public Data Portal 15131225), September 2026 mainland hourly averages, Renuary calculation·© Renuary
From 97.6 won at 4 a.m. to 137.8 won at 7 p.m., with one dip at 1 p.m.
Data Korea Power Exchange (KPX), System Marginal Price and Demand Forecast OpenAPI (Public Data Portal 15131225), simple average of September 1–30, 2026, Renuary calculation·CSV · PNG
Why does the price dip once at midday?
You might expect power to be dearest in the bright middle of the day, but it isn't. The price that rose through the morning dips once in the hour from noon to 1 p.m. (the "1 p.m." row in the table, since each hour is labeled by when it ends). That is when solar output is highest, and demand also eases briefly at lunchtime.
Then, when the sun sets, the price climbs to its highest of the day. The 7 p.m. price is about 1.4 times the 4 a.m. price, roughly 40 won per kWh dearer. The sun and people's daily routines draw the day's price together.
When is the busiest day of the year?
Over a year, demand shoots up in summer, when cooling runs hard, and in winter, when heating does. So every summer and winter the government publishes its *Electricity Supply and Demand Outlook and Measures* (「전력수급 전망 및 대책」; unofficial translation), and KPX handles the demand forecasts and supply operating plans behind it. On June 25, 2026, the government again projected that this summer's peak could reach 94.1 GW in the third week of August, or up to 98.8 GW if it is hotter (1 GW is 1,000 MW).Source 2Ministry of Climate, Energy and Environment, 「올여름 역대 최대전력수요 전망에도 안정적인 전력수급에 총력」 (press release, 2026-06-25; unofficial translation; KDI EIEC copy), attachment p. 4all-time No. 1 on 2024-08-20 at 97.1 GW, No. 2 on 2025-08-25 at 96.0 GW; third-week-of-August peak demand projected at 94.1 GW (base) to 98.8 GW (upper). "About 1,800 MW" is an estimate from 97,100 − 95,321.See in sources →
The single hour in which the whole country has used the most electricity so far came on August 20, 2024, at 97.1 GW. The second highest was 96.0 GW on August 25, 2025. Both records came in August, at the height of the heat.Source 2Ministry of Climate, Energy and Environment, 「올여름 역대 최대전력수요 전망에도 안정적인 전력수급에 총력」 (press release, 2026-06-25; unofficial translation; KDI EIEC copy), attachment p. 4all-time No. 1 on 2024-08-20 at 97.1 GW, No. 2 on 2025-08-25 at 96.0 GW; third-week-of-August peak demand projected at 94.1 GW (base) to 98.8 GW (upper). "About 1,800 MW" is an estimate from 97,100 − 95,321.See in sources →
It is like a highway. Cars pile up on holidays and at rush hour, and the road is empty before dawn. Still, a road has to be built for its busiest days, which come only a few times a year. Power plants and lines, too, must be enough to get through the single busiest moment.
Spikes of 95,321 MW in August 2026 and 88,950 MW in February 2026 (MW is the unit for the size of power used; 1 MW = 1,000 kW), while April and October stay in the 73,000 MW range
Data KPX EPSIS, supply and demand based on daily peak demand, Renuary calculation·PNG
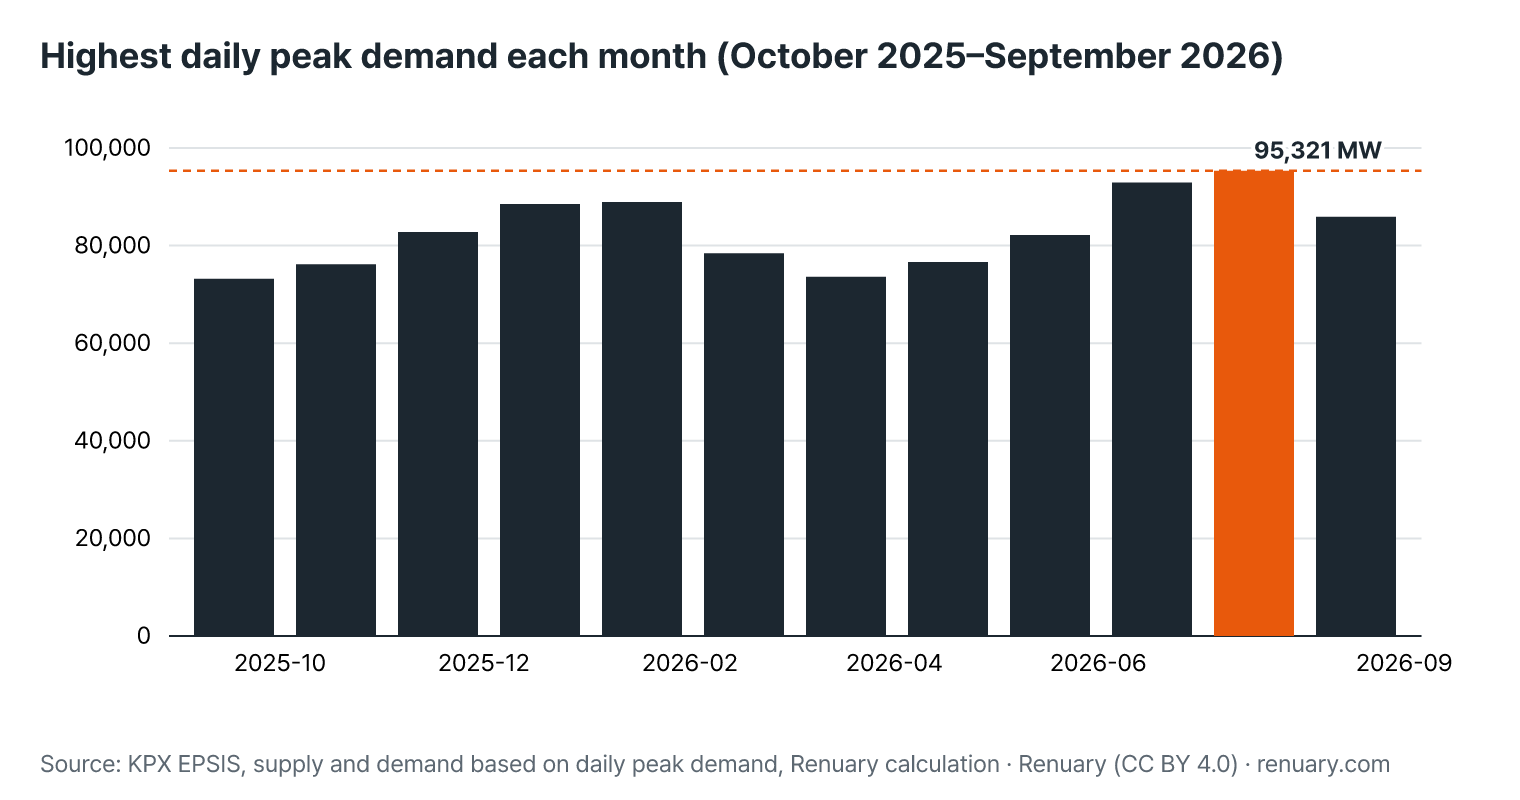
Set the bars side by side and the scale becomes clear. The August 2026 peak of 95,321 MW is about 1.3 times the peak of the quietest months, April and October (in the 73,000 MW range). If the road is widened for August, then even on the busiest day of spring or autumn, close to one car space in four sits empty. Even this high August 2026 came in about 1,800 MW below the 2024 record.
Does my home bill get pricier in the evening too?
No. The electricity bill you pay at home is not directly tied to this wholesale price. Most residential rates charge by how much you use, whatever the hour. Rate plans that charge differently by time of day are not covered in this piece.
Even so, your home is one of those building the evening hill. A home that uses 300 kWh a month (a hypothetical example) uses about 10 kWh a day. Before dawn, while everyone sleeps, little more than the refrigerator runs; after work, lights and appliances come on all at once. Millions of homes do the same thing at the same time, and that is how the evening hill builds up.
What to watch when using these numbers
If you handle these numbers in a report or analysis, a few points are worth noting.
- The hourly values in the table above are a simple average over 30 days, September 1–30, 2026. Day-to-day values swing far more than this.
- Each hour is labeled by "when that hour ends." "7 p.m." is the value for the hour from 6 p.m. to 7 p.m.
- The chart of each month's highest daily peak was compiled and calculated by Renuary from KPX's public data, and the raw data may only be cited.
- The daily average and the top of the year are different numbers. When judging whether there is enough equipment, look at the top.
- The top (peak demand) is not a value at a single moment but the largest 1-hour average of power. The reserve margin is given as reserve divided by peak demand, as a percentage.Source 1Korea Power Exchange (KPX), *Glossary of Power Supply and Demand Terms* (「전력수급관련 용어해설」, kpx.or.kr, accessed 2026-10-27; unofficial translation)peak demand is "the power demand value at which the 1-hour average power is largest"; the supply reserve margin is the supply reserve divided by peak demand, as a percentage.See in sources →
So, when you read power news
Every summer there are headlines like "power Reserve Margin The reserve margin is the spare supply (reserve) secured above electricity demand, expressed as a ratio to demand. It shows the safety buffer against generator failures or sudden jumps in demand. Glossary → in single digits" or "record peak demand this summer." What they worry about is not the daily average. It is how many generators are left to get through the single busiest moment of the year. The problem is not the daily average but the very top of the peak.
- Is it about the top of the year (peak demand), not the daily average?
- The reserve margin is the generating capacity that can still be added in that peak hour (reserve, MW) divided by demand in that hour, as a percentage
- Even when the wholesale price (SMP) rises, your home electricity bill is not directly tied to it
In the end, the 40 won between 4 a.m. and 7 p.m. is a price made by when people use electricity. Know that shape, and the ups and downs of the price and the worries in supply news read as the same picture.
But who sets this price, and who buys and sells? Electricity can't be kept in a warehouse, so its market can't help being different from other markets. That shape is followed in "A product with no warehouse."
Words in this piece
- SMP (System Marginal Price) SMP is the energy price set for each trading hour in the power market. It is the highest generation price among the generators eligible to set the price in that hour. Glossary → — the wholesale price of electricity, set for each hour. It is set by the cost of the last generator switched on in that hour.
- Peak Demand Peak demand is the highest level of electricity demand during a given period. KPX's rules call it 'peak load' and measure it as the largest of the hourly average values. Glossary → — the size of the single hour in a year when the most electricity is used. Power plants and lines are built to match this top.
- Reserve Margin The reserve margin is the spare supply (reserve) secured above electricity demand, expressed as a ratio to demand. It shows the safety buffer against generator failures or sudden jumps in demand. Glossary → — the generating capacity that can still be added in the busiest hour (reserve, MW) divided by demand in that hour, as a percentage.
- kW and kWh A kW (kilowatt) is a unit of power: how hard electricity is made or used at a moment. A kWh (kilowatt-hour) is a unit of energy: how much is made or used over time. Glossary → — the unit that counts the amount of electricity used. Both the home bill and the SMP set prices per kWh.
Source 1Korea Power Exchange (KPX), *Glossary of Power Supply and Demand Terms* (「전력수급관련 용어해설」, kpx.or.kr, accessed 2026-10-27; unofficial translation)peak demand is "the power demand value at which the 1-hour average power is largest"; the supply reserve margin is the supply reserve divided by peak demand, as a percentage.See in sources →: Korea Power Exchange (KPX), *Glossary of Power Supply and Demand Terms* (「전력수급관련 용어해설」, kpx.or.kr, accessed 2026-10-27; unofficial translation) — peak demand is "the power demand value at which the 1-hour average power is largest"; the supply reserve margin is the supply reserve divided by peak demand, as a percentage. Source 2Ministry of Climate, Energy and Environment, 「올여름 역대 최대전력수요 전망에도 안정적인 전력수급에 총력」 (press release, 2026-06-25; unofficial translation; KDI EIEC copy), attachment p. 4all-time No. 1 on 2024-08-20 at 97.1 GW, No. 2 on 2025-08-25 at 96.0 GW; third-week-of-August peak demand projected at 94.1 GW (base) to 98.8 GW (upper). "About 1,800 MW" is an estimate from 97,100 − 95,321.See in sources →: Ministry of Climate, Energy and Environment, 「올여름 역대 최대전력수요 전망에도 안정적인 전력수급에 총력」 (press release, 2026-06-25; unofficial translation; KDI EIEC copy), attachment p. 4 — all-time No. 1 on 2024-08-20 at 97.1 GW, No. 2 on 2025-08-25 at 96.0 GW; third-week-of-August peak demand projected at 94.1 GW (base) to 98.8 GW (upper). "About 1,800 MW" is an estimate from 97,100 − 95,321.
Sources (2)
Sources
- Korea Power Exchange (KPX), *Glossary of Power Supply and Demand Terms* (「전력수급관련 용어해설」, kpx.or.kr, accessed 2026-10-27; unofficial translation) ↩peak demand is "the power demand value at which the 1-hour average power is largest"; the supply reserve margin is the supply reserve divided by peak demand, as a percentage.
- ReleaseMinistry of Climate, Energy and Environment, 「올여름 역대 최대전력수요 전망에도 안정적인 전력수급에 총력」 (press release, 2026-06-25; unofficial translation; KDI EIEC copy), attachment p. 4 ↩all-time No. 1 on 2024-08-20 at 97.1 GW, No. 2 on 2025-08-25 at 96.0 GW; third-week-of-August peak demand projected at 94.1 GW (base) to 98.8 GW (upper). "About 1,800 MW" is an estimate from 97,100 − 95,321.
Ask about this postQuestions shape the next pieces
Comments
- Loading…